If you were a longtime WellnessFX user like me, the recent shutdown of the service was quite disruptive. It was a good way to view blood draw biomarker data and understand important thresholds for healthy living. I exported all of my data (CSV) before the service went offline and have been poking around for a similar data visualization service to fill the gap. Unfortuantely I haven't found anything.
InsideTracker looks pretty good, but at $100/blood draw for import, I'm not up for the several thousand dollar tab just to get my old data into the service. Missed opportunity on their part, as typically subscription services support free backlog import in order to get you on the monthly subscription fee treadmill.
I figured I could manage the same graphing/visualization value with a little work in Google Sheets. What I came up with was a pretty simple setup that lets me see all my charts, and that allows me to blend in new data easily as I do new blood draws. It's pretty simple.
- Upload/Import your raw data csv into Google Drive, then open it in Sheets. You'll have one Sheet that acts as your raw data repository, and this is the one you'll import/manually add new results to in the future. I called this one "raw".
- Create a new sheet for each biomarker you care about, e.g. "Total Cholesterol."
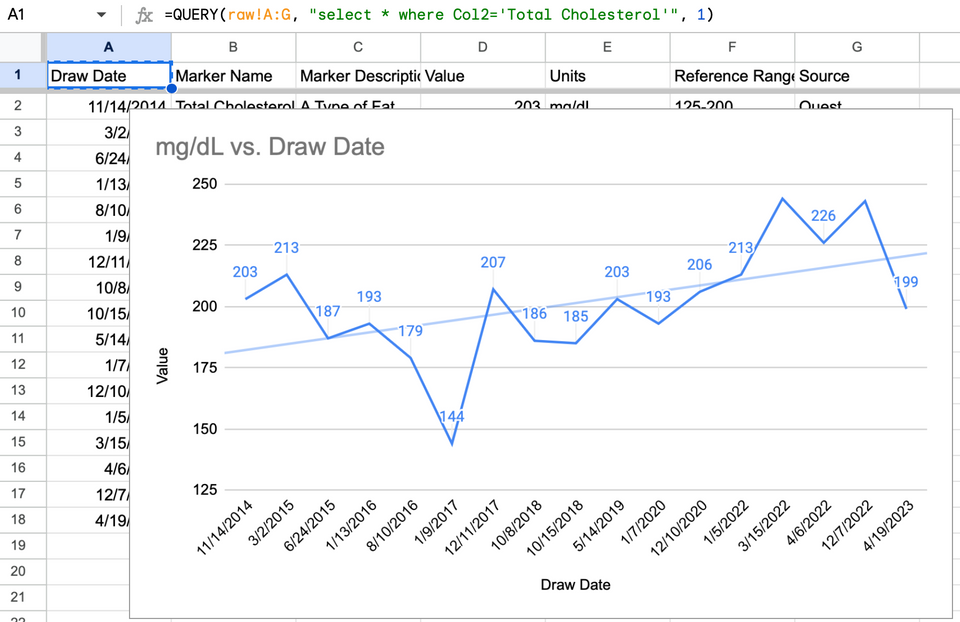
- In cell A1 you'll insert a QUERY function that extracts the data you want from the "raw" Sheet, and dumps it into each particular biomarker Sheet. Here's one mine looks like. You can also see this in the screen-cap at the top of this post.
=QUERY(raw!A:G, "select * where Col2='Total Cholesterol'", 1)
- Note that I'm referencing my "raw" sheet and that I'm referencing all of the rows from column A to column G. This is important as I don't want to have to update row counts in all of my biomarker sheets everytime I add new data to the raw Sheet. Depending on your csv's structure, you may be referencing different columns to match your biomarker string.
- This will yield all of your Total Cholesterol biomarkers in your new Sheet. From there, Insert->Chart and tweak until you get it to look the way you want.
- Rinse and repeat a new Sheet for each biomarker you care about.